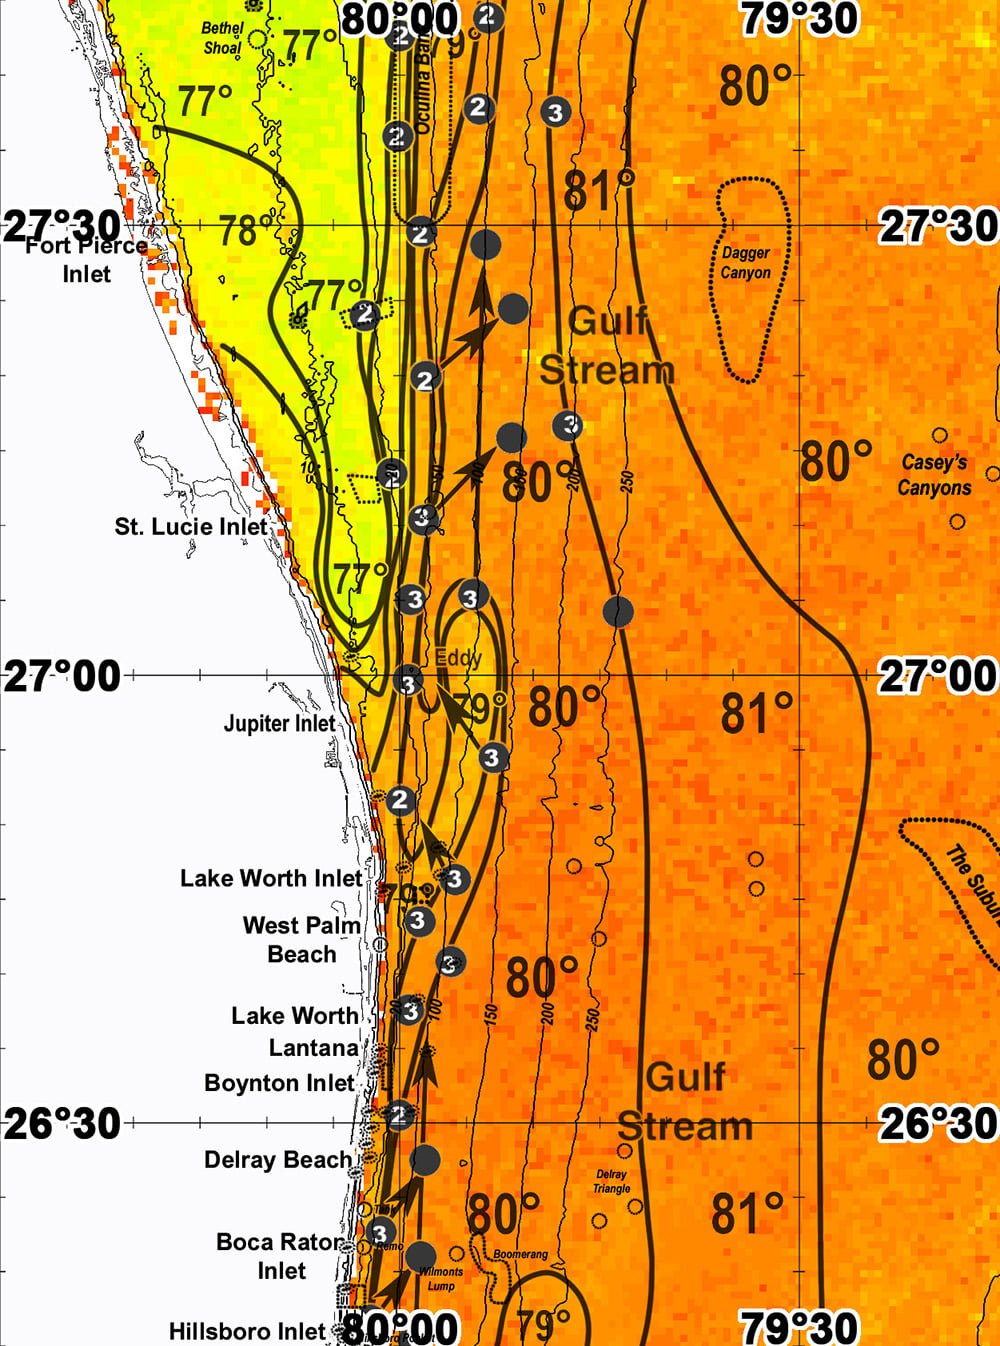
Starting this week ROFFS® has started using its new Southeastern U.S. analysis areas. These areas are all no longer tilted and are now “north up” with Lat./Long. grids being displayed in a perpendicular fashion to make them easier to read along with making them more user-friendly for other MFD’s and systems. We are also launching all of these areas in Tom Hilton’s app/system Hilton’s Real-Time Navigator – please contact Tom directly at 713.530.2267 or visit his site here for more details.
We have also made other small improvements to the ROFFS® fishing forecasting analysis charts such as making the bottom cleaner in order to make it a closer match to what you will be viewing on your MFD (GPS) device while offshore. We have also, based on feedback (thank you!) made our water mass boundary lines thinner, made our dots thinner, removed the ocean color labels as the ocean color is included as a separate page and made the layer with the SST trace, dots & spot temperatures semi-transparent so you can see the bathymetry underneath.
Lastly, we have updated our text format. The first paragraph will still include what satellite imagery we used to complete our analyses, verified fishing reports and a description of the overall ocean conditions and circulation in the area. This will be followed by several tables separated by location which will list the favorable coordinates (dot locations), bottom topography/bathymetry at these locations and any notes about the area.
Please see below for a sample of one of the new charts and text along with a video describing all of the above mentioned changes. If anyone has any feedback on any of the new charts/areas, the changes in the text format or the changes to our analyses, please direct them to the office at 321.723.5759 or via email at [email protected].