Article Courtesy: ecomagazine.com | Originally published Aug 2015 | Please click here for original article.
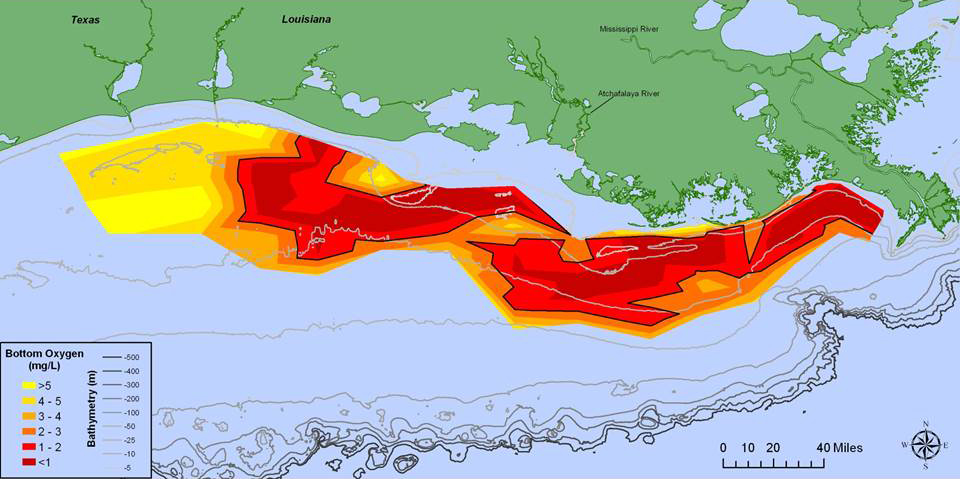
Above: Image caption: Distribution of bottom-water dissolved oxygen from July 28 to August 3, west of the Mississippi River delta. Black lined areas — areas in red to deep red — have very little dissolved oxygen. Data: Nancy Rabalais, LUMCON; R Eugene Turner, LSU. Map credit: NOAA.
Scientists have found this year’s Gulf of Mexico dead zone — an area of low to no oxygen that can kill fish and marine life — is, at 6,474 square miles, above average in size and larger than forecast by NOAA in June. The larger than expected forecast was caused by heavy June rains throughout the Mississippi River watershed.
The measured size this year — an area about the size of Connecticut and Rhode Island combined — is larger than the 5,052 square miles measured last year, indicating that nutrients from the Mississippi River watershed are continuing to affect the nation’s coastal resources and habitats in the Gulf. The size is larger than the Gulf of Mexico / Mississippi River Watershed Nutrient Task Force (Hypoxia Task Force) target of 1,900 square miles.
“Dead zones,” also called hypoxia areas, are caused by nutrient runoff from agricultural and other human activities in the watershed and are highly affected by river discharge and nitrogen loads. These nutrients stimulate an overgrowth of algae that sinks, decomposes, and consumes the oxygen needed to support life in the Gulf. Dead zones are a major water quality issue with an estimated total of more than 550 occurring annually worldwide. The Gulf of Mexico dead zone is the second largest human-caused hypoxic area in the world.
“An average area was expected because the Mississippi River discharge levels and associated nutrient data from May indicated an average delivery of nutrients during this critical month which stimulates the fuel for the mid-summer dead zone,” said Nancy Rabalais, Ph.D. executive director of the Louisiana Universities Marine Consortium (LUMCON), who led the July 28 to Aug 3 survey cruise. A suite of NOAA-sponsored models forecasted a range of 4,633 to 5,985 square miles based on May nitrogen loading data provided by USGS. “Since the models are based largely on the May nitrogen loads from the Mississippi River, the heavy rains that came in June with additional nitrogen and even higher river discharges in July are the possible explanations for the larger size,” said Rabalais.
Funded by NOAA and the EPA, the annual measurement mapping of the dead zone provides a critical scientific record of the trend of hypoxia in the Gulf, as well as the primary measure of progress used by the Hypoxia Task Force to determine whether efforts to reduce nutrient loading upstream in the Mississippi River Basin are yielding results. This year marks the 30th annual ship-based sampling that is the backbone of the mapping effort.
“The importance of having continued and sustained coastal observations are foundational in helping us better understand the size and impacts of the Gulf dead zone. This information ultimately informs the best strategies to reduce the size and the impacts of the dead zone, which will help improve the sustainability and productivity of our coastal economy,” said Holly Bamford, Ph.D., assistant NOAA administrator for the National Ocean Service performing the duties of the assistant secretary of commerce for conservation and management.
“The annual ship-based sampling is the backbone of the mapping effort,” said Diane Altsman, chief of staff of the EPA Gulf of Mexico Program. “It is important for us to partner with NOAA on supporting the cruise this year to ensure that the Gulf of Mexico Hypoxia Task Force has the critical information needed to assess their progress in mitigating hypoxia, part of our effort to restore the Gulf coastal ecosystem.”
The largest previous Gulf of Mexico dead zone was in 2002, encompassing 8,497 square miles. The smallest recorded dead zone measured 15 square miles in 1988. The average size of the dead zone over the past five years has been about 5,500 square miles, nearly three times the 1,900 square mile goal set by the Hypoxia Task Force in 2001 and reaffirmed in 2008.
The hypoxic zone off the coast of Louisiana and Texas forms each summer threatening the ecosystem that supports valuable commercial and recreational Gulf fisheries. NOAA-funded research in the past decade shows hypoxia results in habitat loss, displacement of fish (including shrimp and croaker) from their preferred areas, and a decline in reproductive ability in some species.
Visit the Gulf Hypoxia web site for additional graphics and information concerning this summer’s LUMCON research cruise, and previous cruises.


