Season Fishing Forecast for 2014:
LOOKING GOOD ALREADY
By Mitchell A. Roffer, Ph.D.
Introduction:
Since 2003 we have been developing an objective method for forecasting the overall fishing action during the entire Bahamas Billfish Championship (BBC) tournament season. The hypothesis for forecasting the seasonal marlin fishing action stems from the location and geographic extent of the bluer and often warmer water that occurs from the Cat Island – San Salvador Island area and south where it is presumed that the marlin concentrate before, during, and after spawning. We have been calling this water “blue marlin water.” From satellite data it is relatively easy to identify this water based on its signature optical characteristics and surface water temperature. Our working hypothesis is that the marlin are associated with this water and the more “blue marlin water” that exists in the Abaco Islands and Eleuthera Island areas, the greater the marlin relative apparent abundance will be in these areas. Also in recent years we have observed an association between this water and the yellowfin tuna action in the Bahamas, as well as, along the western side of the Gulf Stream between Jacksonville, Florida and Cape Hatteras, North Carolina, as well as, in the canyon areas to Massachusetts. But as this article is focused on the blue marlin and the Bahamas, the discussion related to yellowfin tuna, the overfishing off west Africa, and catch rates off the United States east coast will have to wait for another article as we have time over the next few weeks.
Based on our observations of the fishing action and ocean conditions in the Bahamas, particularly from Eleuthera to the Abacos over the last 20+ years it appears that excellent fishing action overall occurs within the BBC tournament area when there is a substantial volume of the “blue marlin water” pushing over the 100 fathom (600 feet, 200 meters) and shallower ledges along the eastern side of Eleuthera and the Abacos. Relatively good fishing seasons occur when this water only occurs over the 500-1000 fathom depths, but does not reach the 100 fathom and shallower depths of both areas. Mediocre years occur when there is a lack of this water over these areas. It is also important to understand that good fishing action on a daily basis is linked to the favorable direction of these currents and when the water mass boundaries of these currents are stable for three to five consecutive days over good bottom topography that normally concentrate the prey fish. For the BBC tournament areas, the dissolved oxygen concentration does not appear to be a major factor at the present time compared with the temperature and clarity of the water. In other areas south, the dissolved oxygen has a greater controlling factor on fish distribution.
The working hypothesis is based on the hourly satellite observations of the ocean conditions derived by Roffer’s Ocean Fishing Forecasting Service, Inc. – ROFFS™ (roffs.com) and catch reports provided by a variety of sources over 20+ years. The infrared (IR) satellite data are used to observe the sea surface temperature (SST) and the ocean color data are used for indices of phytoplankton (chlorophyll), water clarity, and colorized dissolved organic material are received from a variety of sources including NASA, NOAA, Suomi National Polar-orbiting Partnership (SNPP or JPSS), and the European Space Agency (ESA) satellites. ROFFS™ also uses data derived from drifting buoys, gliders, aircraft, private boats, and satellite altimeters. The altimeter data only provide a very coarse spatial and temporal resolution with a time delay (5-10 days to produce usable circulation models) that limits the data’s utility related to high resolution and real-time operational oceanography. While the ocean changes significantly over such short periods, the altimeter data can be used for an overall, albeit 5-10 day average view of the ocean’s surface circulation. It is not useful for evaluating small scale, short-term (daily and sub-daily) changes in the ocean currents or their boundaries.
During the last several years we had observed that the conditions over the BBC tournament area were particularly favorable as early as January to the first week in March in terms of the presence of “blue marlin” water off Abaco and Eleuthera as exemplified by the first week in March 2012 (Figures 1 & 2).
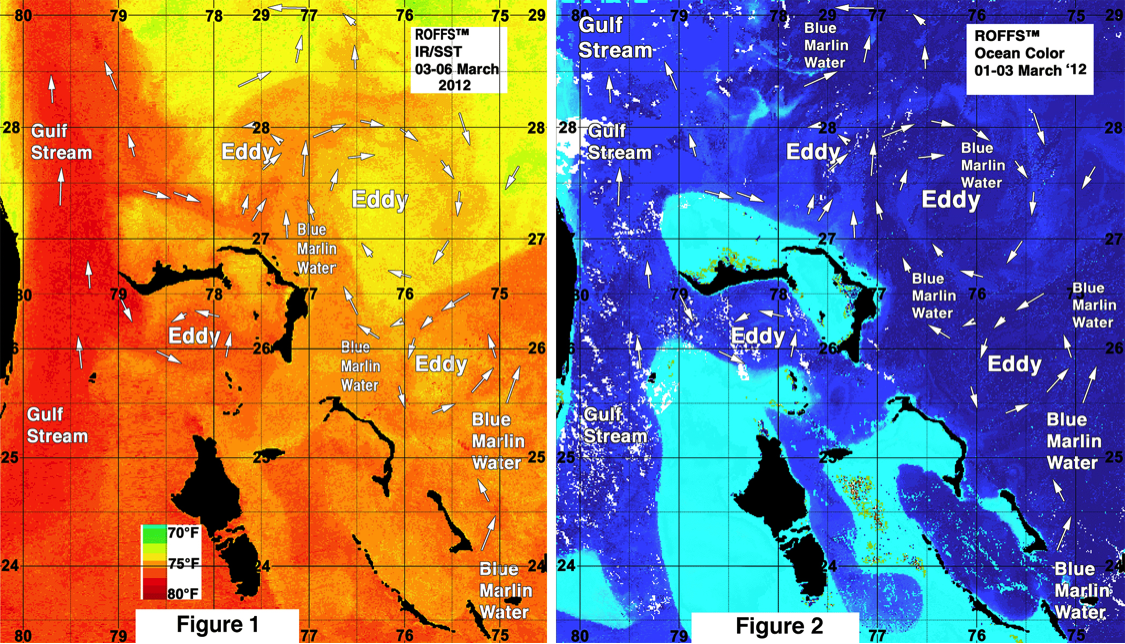
As stated earlier, the critical aspect for having a good blue marlin season is the presence of the blue marlin water pushing over the 100 fathom curve creating persistent convergence zones for food to concentrate. Figures 1 and 2 show the distribution of the blue marlin water prior to the 2012 BBC season. Figure 1 was derived over the March 03-06, 2012 period using a variety of IR satellite data from NOAA, NASA, and ESA that shows the water masses based on their signature sst. Figure 2 is an ocean color image that was derived from NASA and ESA satellites over March 01-03, 2012 that shows the water masses based on their signature ocean color. Clouds prevented us from providing an exact match in time due to the clouds associated with the strong cold front that stalled over the Bahamas during this period. However, using a variety of computer techniques ROFFS™ was able to remove many of the interfering clouds to allow a one day overlap of the imagery to provide a better comparison.
During the actual 2011, 2012, and 2013 tournament fishing seasons the “blue marlin” water was pulled away from the BBC tournament area by the ocean currents from various eddy features similar to what had been observed prior to the fishing season in 2011 (Figures 3 & 4). While some good fishing action happened during these years due to the intermittent arrival of the “blue marlin” water and the general migration of the fish through the area, unfortunately the favorable conditions were not persistent throughout the entire tournament season like some of the banner years in the 1990’s and early 2000’s. We do not know if this is the new trend in the oceanography in the region, but outside the scope of our current research. This is something that an altimeter study could resolve.
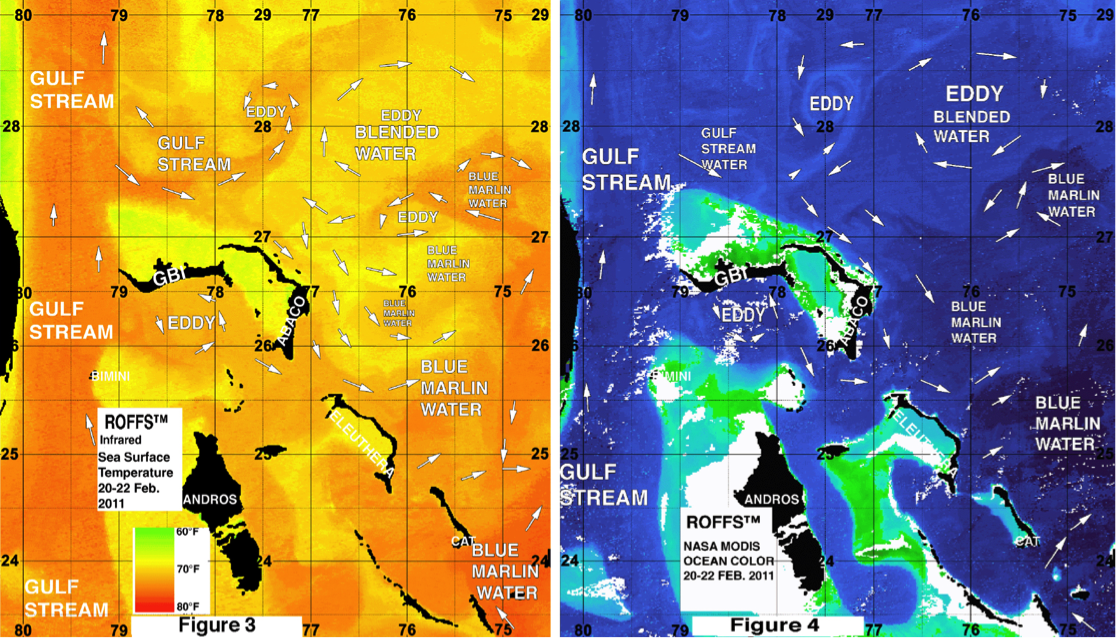
Figure 3 was derived from a variety of NASA and NOAA IR satellites and Figure 4 was derived from the NASA MODIS ocean color imagery during February 20-22, 2011. While these provide examples of pre-season conditions, they also provide examples of how the eddy features pulled the “blue marlin” water away from the BBC tournament area.
Background and Some Data for 2014
In years past we had been instructed to forecast the entire BBC season from data available at the end of February and first week of March, by the then “King of the BBC” (Al Behrendt). However, this year Jennifer has taken over and has allowed us to wait until later in the month to provide the update. The king is dead, long live the queen. One of the challenges of producing a such an early forecast is that these exciting, entertaining, and fun fishing events extend over a relatively long time period from the end of April or first week of May through the third or fourth week of June. This year (2014) the first BBC tournament starts May 7th. Conditions are likely to change dramatically from one fishing event to the next without any scientifically proven and field-tested methods to predict the changes over the two month period. Sorry, there still are no reliable numerical oceanographic models to use to make accurate and reliable high resolution localized oceanographic forecasts that extend for several days, never mind the entire season. ROFFS™ is working with other oceanographers to develop improved ocean and climate models, so perhaps next year our task for the seasonal forecast will be easier.
At ROFFS™, for forecasting short-term oceanographic conditions related to finding fish we generally believe that the conditions observed now are the ones likely to continue into the short-term future (days) unless we can see the mechanisms (currents) that would drive the changes. While we have two crystal balls in our office for forecasting, we prefer to use data and we have learned that evaluating the preseason conditions annually provides insight into future seasonal trends. Experience is our guide as we have had moderate success in forecasting seasonal trends of fishing productivity based on the location, condition, and likely future changes of the fishes’ preferred habitat in time and space. In the case of the BBC tournament season we derive our first indications during the first week in March in that whether or not we are observing “normal” (climatologically mean conditions) or anomalies. For this we rely on satellite data and a climate models from some of the experts in the field. One indication is sea surface temperature (SST) in the core of the Gulf Stream off Miami and the SST of the Bahamas blue marlin water east of Cat Island. Because we started our forecasting studies during the first week of March in 2003 we have continued our time series using that week.
The ROFFS™ 12 year (2003-2014) mean SST for the core of the Gulf Stream off Miami is 78.3°F during our standard March 05-06, 2013 measurement period. The SST has been as low as 74.8°F (2009) to a high of 80.5°F (2007) and we have not observed any overall trends as of yet unlike other areas such as in New England and in the Gulf of Mexico (increasing). Climate variability is not evenly distributed. This year the SST was 79.1°F in the Gulf Stream off Miami. While have not been recording the SST off Cat Island as long, the seven year mean (2008 – 2014) SST for the Cat Island area is 76.5°F and this year the SST was a warmer 78.1°F, the warmest year to date for our limited data set. During March 21, 2014 these SST were 79.8°F (Gulf Stream) and 79.1°F (Cat Island). Early warming off Cat Island could signal an early start to the good marlin action. That remains to be seen.
The global, hemispheric and regional climate models also provide guidance into the present and future conditions. We usually use the climate data, analyses, and forecasts provided by Columbia University’s International Research Institute (IRI) for Climate and Society (http://iri.columbia.edu/our-expertise/climate/forecasts/seasonal-climate-forecasts/), NOAA’s Climate Prediction website (http://www.cpc.ncep.noaa.gov), and the National Center for Atmospheric Research (NCAR https://climatedataguide.ucar.edu/about), as well as, sage advice from our colleagues at NOAA’s Atlantic Oceanographic and Meteorological Laboratory (AOML http://www.aoml.noaa.gov/) and the University of Miami’s Cooperative Institute for Marine and Atmospheric Studies (CIMAS http://cimas.rsmas.miami.edu/ ). We use catch data from a variety of public and private sources. Based on the 2014 IRI multi-model probability forecast, the precipitation is expected to be the climatological mean, or what many people refer to as “normal” conditions over the April-May-June period. Air temperature is most likely to be above normal and sea surface temperature is expected to be 0.4-0.9°F above the mean. This suggests that the marlin will not be delayed due to lower than normal water temperature and that perhaps an early season is possible depending on the other conditions.
As we are learning more about air – sea interaction we started considering other indices a few years ago such as the North Atlantic Oscillation (NAO) and the Atlantic Multidecadal Oscillation (AMO). Without going into great detail the NAO is the dominant mode of winter climate variability in the North Atlantic region ranging from central North America to Europe and much into Northern Asia. The NAO is a large-scale seesaw in atmospheric mass between the subtropical high and the polar low. The corresponding index varies from year to year, but also exhibits a tendency to remain in one phase for intervals lasting several years. The North Atlantic Oscillation (NAO) is a climatic phenomenon in the North Atlantic Ocean of fluctuations in the difference of atmospheric pressure at sea level between the Icelandic low and the Azores high. Through east-west oscillation motions of the Icelandic low and the Azores high, it controls the strength and direction of westerly winds, currents, and storm tracks across the North Atlantic Ocean. It is part of the Arctic oscillation, and varies over time with no particular periodicity. It appears to be one of the most important manifestations of climate fluctuations in the North Atlantic and surrounding humid climates (see Wikipedia and the previously listed web links for more details). For future reference the 2014 NAO index for January and February was positive 0.29 and 1.34 respectively. In 2013 NAO Index was positive (0.35) and February negative (-0.45), while in 2012 it was 1.17 and 0.42 respectively. The ensemble forecast is for negative NAO beginning in April.
The Atlantic Multi-decadal Oscillation (AMO) has been identified by some as a coherent mode of natural variability occurring in the North Atlantic Ocean with an estimated period of 60-80 years. It is based upon the average anomalies of sea surface temperatures (SST) in the North Atlantic basin, typically over 0-80N. (https://climatedataguide.ucar.edu/climate-data/atlantic-multi-decadal-oscillation-amo). The AMO Index in 2013 in January and February was positive 0.158 and 01.47 and in 2012 it was -0.038 and 0.031 respectively. For January 2014 it was -0.039, but values for February were not available (http://www.esrl.noaa.gov/psd/data/timeseries/AMO/).
Regarding El Niño we have yet to see or read about any direct relationship between El Niño – La Niña and the oceanographic conditions in the Bahamas. However, we continue to report the conditions. Presently we are El Niño neutral, although there are some discussions about increasing chances for an event in the fall. We will continue to investigate the relationship between the North Atlantic Ocean climate and the oceanographic conditions in the Bahamas in the future. But we included this information to spark your interest in climate indices.
Conditions in March 2014
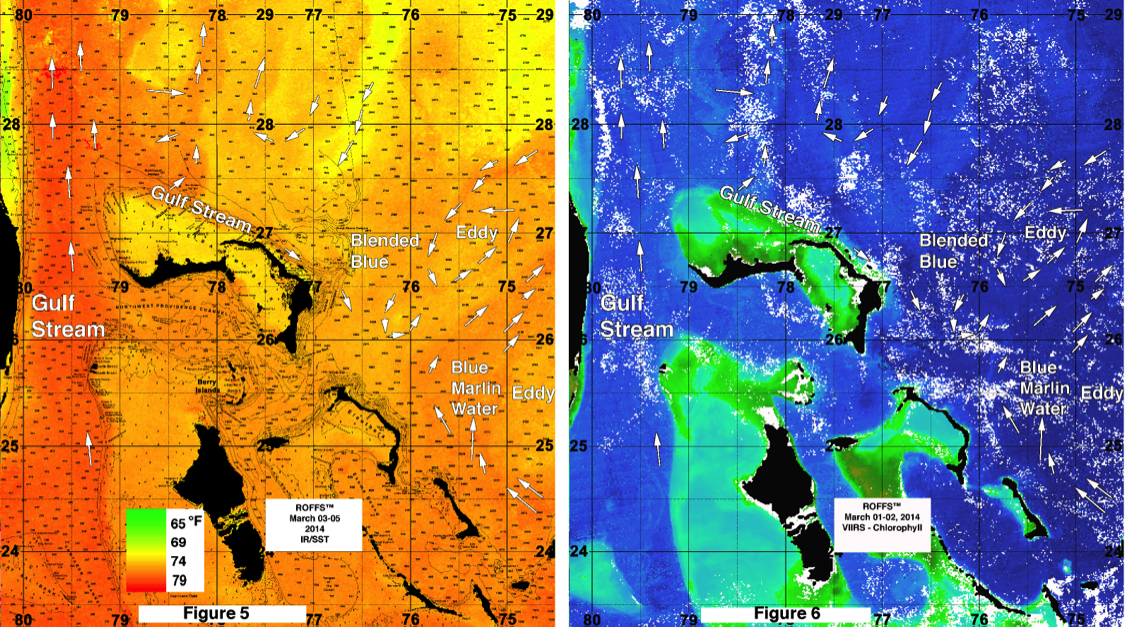
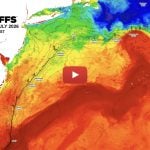
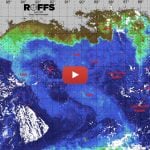
Figure 5. (left hand side) was derived from a variety of infrared sensors on NASA, NOAA, ESA and SNPP satellites during March 03-06, 2014 and Figure 6 was derived from the ocean color imagery during March 01-02, 2014 from the VIIRS sensor on the SNPP satellite.
From the satellite data shown in Figures 5 and 6 we observed that there are two eddy features controlling the movement of the blue marlin water from the Cat Island – San Salvador region. East of Eleuthera there is a relatively symmetrical clockwise rotating eddy is centered near 74°45’W & 25°15’N and northeast of Abaco there is an elliptical shaped counterclockwise rotating eddy centered near 75°30’W & 26°55’N. The eddy east of Eleuthera is pulling the relatively darker blue water – marlin water (77°-78°F) from the Cat Island area northwestward toward Eleuthera before pulling in more northeastward. While this is favorable for bringing marlin to Eleuthera it is not favorable for bringing marlin to Abaco. However, the elliptical eddy northeast of Abaco is pulling the blue marlin water southwestward, which is somewhat favorable. A blend of the blue Cat Island water and Gulf Stream water occurs east of Abaco. While this is not ideal for bringing the greatest abundance of marlin to the topographic ledges near Abaco, it is favorable for bringing marlin to the general Abaco area. But these conditions are very good for bringing marlin to the southeastern side of Eleuthera from Palmetto Point and south. The SST east of both island areas was in the 76°F-77°F range which is relatively cool than what one would usually expect for an abundance of blue marlin to exist in these areas at this time. We usually expect more marlin to arrive when the SST is in the 78°F-80°F range. Keep in mind that blue marlin spend considerable amounts of time in subsurface waters substantially cooler than 76°F-77°F when they are in this region during the May – June fishing season, suggesting that the arrival of some blue marlin under these temperature conditions is likely. We would also expect white marlin, roundscale spearfish, wahoo, mahi and yellowfin tuna in these waters.
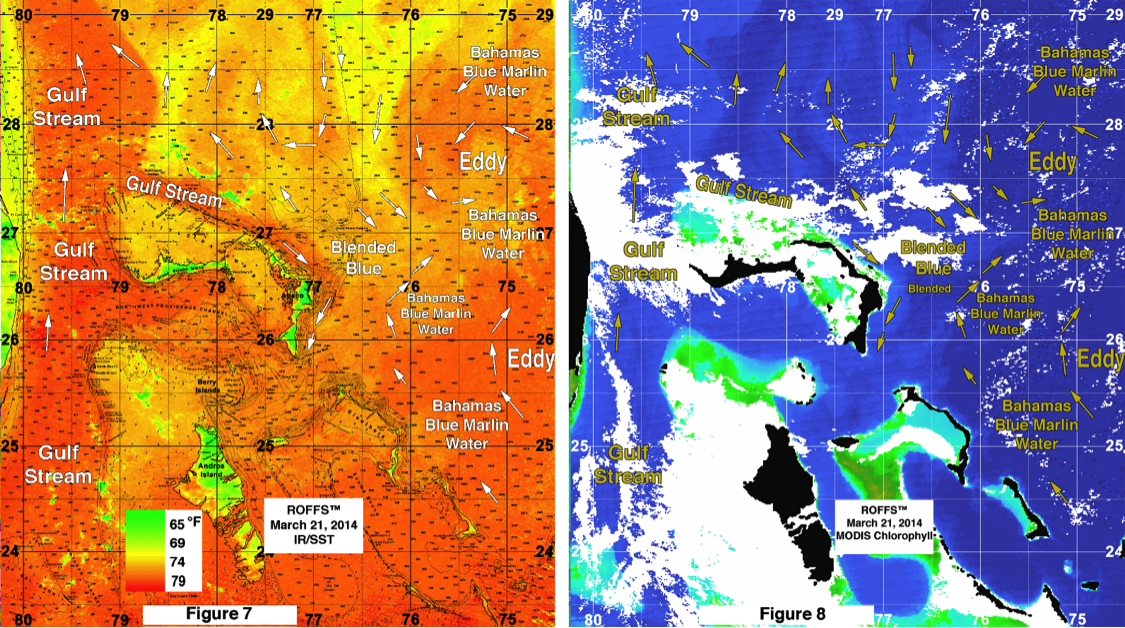
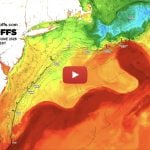
Figure 7 (left hand side) was derived from a variety of infrared sensors on NASA, NOAA, ESA and SNPP satellites during March 21, 2014 and Figure 8 was derived from the ocean color imagery during March 21, 2014 from the MODIS sensor on the Aqua satellite.
From the first week of March (Figures 5-6) to the third week (Figures 7 and 8) one observes substantial differences. The SST has increased and both eddy features have moved northward. While the clockwise rotating eddy east of Eleuthera has remained symmetrical, the counterclockwise eddy northeast of Abaco has further developed into a larger and more symmetrical feature and is pulling more blue marlin water westward closer to the Great Abaco Canyon area (centered near 76°45’W & 27°05’N). In addition, off Eleuthera the Bahamas blue marlin water has moved northwestward over James Point and its northwestern boundary appears near 76°20’W & 26°00’N to 76°00’W & 26°15’N which also is within the 60 mile BBC tournament boundary from Abaco. Presently the SST off Abaco and Eleuthera are in the 77°F-79°F range and are thus, within the preferred thermal habitat of blue marlin. We received a few reports of a few blue marlin being caught off Abaco during the second week of March and anticipate that more will arrive over the next several weeks. Compared with the conditions during the first week of March 2014, these substantially better for bringing in an abundance of blue marlin and other fish into this area.
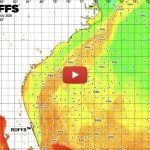
The question now becomes what will these eddy features do in the next 6-12 weeks? For this we look at the larger scale satellite imagery derived from the altimeter sensor. We use the NOAA/AOML CoastWatch free altimeter site for gathering such data. Figure 9 shows the present larger scale view of the Bahamas and east.
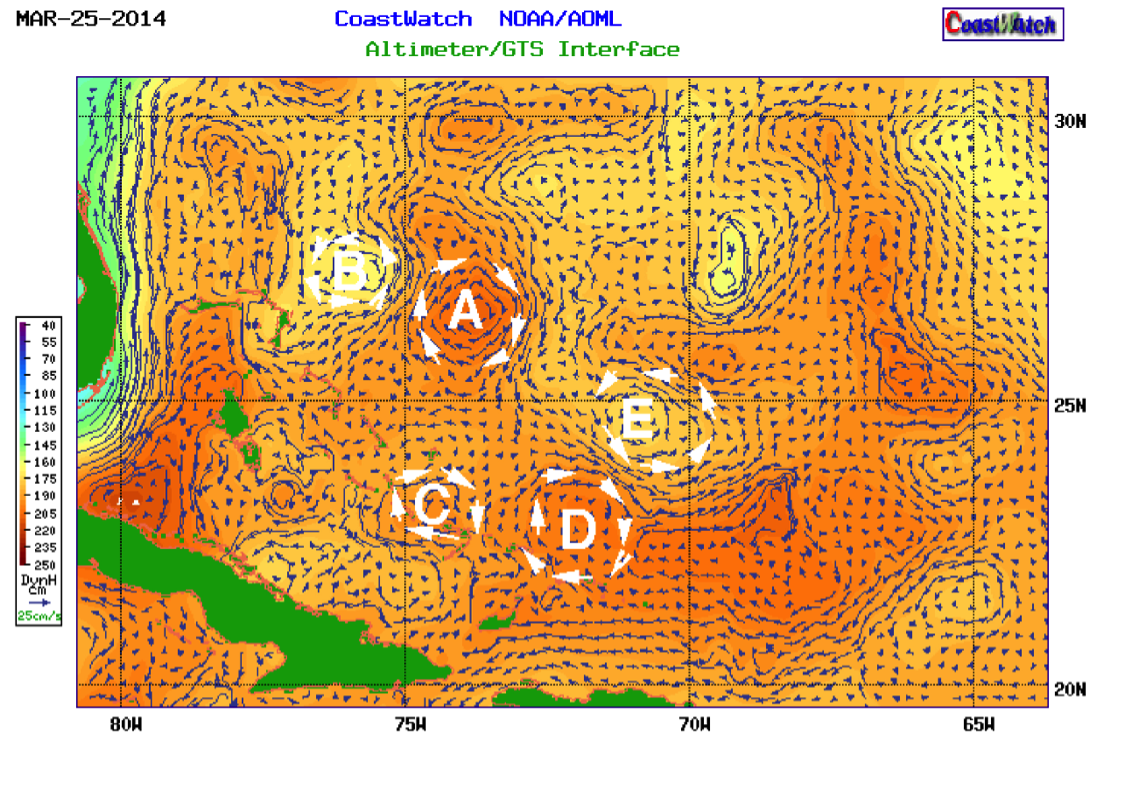
Figure 9. Altimeter based currents for March 25, 2014. Five eddy features (A-E) are outlined. See
(http://www.aoml.noaa.gov/phod/dataphod/work/trinanes/INTERFACE/) for this data.
We outlined five eddy features that are likely to have an influence in the larger scale circulation in the Bahamas. Eddy features “A” (clockwise rotation northeast of Eleuthera) and “B” (counterclockwise northeast of Abaco) have already been discussed earlier in this article. Based on the previous history of eddy features of similar size in this area we anticipate that Eddy “A” and “B” will move northwestward over the next several weeks. This suggests that a substantial amount of blue marlin water will be moving to the Great Abaco Canyon over the month of April. Unfortunately, we have not been able to find any other proven method to forecast the motion of these features with the appropriate accuracy and precision to better forecast their motion over time. These two and the other eddy features shown in Figure 9 will also be interacting with each other, which will affect their behavior. For May and June we believe that eddy “D” and “E” will have a strong influence on the conditions in the BBC tournament area. These two appear to have a more developed circulation compared with eddy “C” and less likely to be influenced by the various islands in the southern Bahamas. We suspect that eddy “C” will degenerate due to the instabilities created by the islands and the ocean floor in relatively shallow waters. Eddy “D” is likely to move northwest toward Cat Island and Eleuthera. When it comes in proximity to Cat Island it is likely to pull the Bahamas blue marlin water away from Eleuthera at first, but if it continues toward Abaco, then it will be pulling the important waters and fish toward Abaco. If it moves more northward from Eleuthera, then it will effectively be pulling the water and the fish northward.
Bottom Line:
Based on what we have been observing over the last three weeks it appears that a substantial amount of Bahamas blue water now exists in the BBC tournament area. Water temperatures are rising and based on the climate forecasts we anticipate a warmer season than “normal” suggesting perhaps an early arrival of blue marlin into this area. Certainly not a late arrival. The location of the eddy features now suggest that the eastern side of Eleuthera especially Palmetto Point and the Great Abaco Canyon will be the beneficiary of the favorable conditions compared with other areas particularly for the early two tournaments. It remains to be seen what the other eddy features do regarding the later tournaments. Assuming that the rate of overfishing on these stocks has not increased, the bottom line is that these are particularly good conditions for good blue marlin action this BBC season and we anticipate an abundance of blue marlin, along with other highly migratory fish to occur in this area through June.
We will continue monitoring these developments as the season progresses and will provide updates. Not only are these blue water conditions important for the fishing success in the Bahamas, but also we have learned an association of the blue marlin water and the relative apparent abundance of highly migratory fish in northeast Florida to North Carolina, as well as, over the canyon areas of the middle Atlantic states (Massachusetts to Virginia). We will write a separate forecast for these areas soon.
Also it is very important to note that good fishing action on a daily basis is strongly linked to local current conditions that concentrate the fish once the preferred habitat of the fish are in a particular region. When the water mass boundaries of these currents are favorable, i.e., persistently pushing over “good” bottom topography, then they concentrate the bait fish and larger fish can be found foraging. This means that the fishing action on any given day is controlled by relatively short term (hourly to daily) and relatively small scale (1-4 mile) movements of the currents and their water mass boundaries. Our experience indicates that to reliably forecast specific concentrations of fish on a daily basis one must evaluate the ocean conditions on these scales. Relatively small subtle changes in the currents and their boundaries often have dramatic effects on the distribution and concentration of fish. Stay tuned for these daily fishing forecasting analyses. Get ready for the BBC and other fishing action as the fun in the Bahamas and elsewhere is about to happen!
Safe and Successful Fishing,
Mitchell A. Roffer, Ph.D.