We started providing our analyses as a civic duty to educate and warn the public (Gulf of Mexico region, southern and eastern coast of Florida, Cuba and Bahamas) how the oil would travel and affect the offshore and coastal areas. We also wanted to demonstrate the utility of satellite remote sensing for operational and research needs. We have effectively done this. We now understand the economic an social magnitude of the oil spill and are continuing our work on a daily basis. Not all of our analyses available to the public at this time. However, we plan on providing a public analysis once a week until we can not afford to continue.
In our ROFFS™ Oil Oceanographic Analyses we have been monitoring the surface, as well as the suspected and apparent subsurface oil-water-dispersant mixture from satellite data derived from NOAA_AVHRR and Metop_A – AVHRR (infrared), MODIS (infrared, ocean color, and RGB) and MERIS (ocean color and visible) sensors, as well as synthetic aperture radar (SAR) with a variety of resolutions and spectra). We also use on-site reports from fishermen, other vessels of opportunity, and researchers (academic and government). We track the water-oil-dispersant mixture that originated from the Deepwater Horizon well site from the first day of the spill by following the water masses that originated from the spill site. We felt that this oil-water-dispersant mixture would form undersea plumes as per the National Research Council’s report and my experience with oil spills in NY as a graduate student. I was on the Nassau County Department of Health Oil Strike Team which investigated oil spills.
With the Deepwater Horizon oil spill we wanted to track the surface oil, as well as, any subsurface oil-dispersant mixture. When the oil spill first started in April, 2010 we observed that there was a cooler water surface signature in the infrared satellite data that we were able to follow from satellite image to satellite image. We continued to follow the relatively cooler water masses as they spread from the spill site image by image, day by day. Knowing and acknowledging that we were uncertain of what was in these water masses. We followed one water mass from the spill site to the forming cyclonic (counter-clockwise circulation) eddy west of Tampa. On May 15, 2010 we received a SAR image that showed a surface signature of oil in the location where we had been following one of these water masses. Since May 15th we have seen the surface signature of the subsurface oil-water mixture in SAR imagery that most likely resulted from upwelling. This happened first along the eastern side of the Loop Current eddy “Franklin” when it was forming and in the eddy located southwest of Tampa (June 11, 2010). In addition, the RV Walton Smith provided verification that oil (globs, tar balls, and sheen) was in the water in the eddy southwest of Tampa. At other times during the last two months we have received verification of oil being in the water column and at the surface from research colleagues at the University of Southern Mississippi (Dr. Jim Franks), our clients fishing west of Tampa, and other clients off Destin, FL.
The RV Walton Smith also found oil where we had suggested it would likely to occur during the June 5-9, 2010 cruise. This was oil that had not been mapped on any official government product that were publically available and in a location where we believed that there would be a mixture of oil, dispersants, and water. From the forgoing information we feel that our techniques in following water masses using our sequential image analysis technique have been validated for tracking the water masses originating from the Deepwater Horizon spill site, as well as, mapping surface oil. These are some of the same techniques that we have been using for years in our fishing forecasting and our ship routing business.
We are using a substantial number of U.S. NOAA (NOAA_15, 16, 17, 18, 19) and NASA (Aqua and Terra) and European (ESA) satellites (ENVISAT and Metop_A) with a variety of spectral (infrared, near infra-red, visible, RGB and synthetic aperture radar) and spatial resolutions (75 meters to 1 KM) to see the oil and follow the water masses associated with the spill. The MODIS satellite data are being received from the University of South Florida IMaRS and the synthetic radar (SAR) imagery is being received from the European Space Agency (ESA) and the CSTARS at the University of Miami. We have received SAR imagery from the NASA’s Jet Propulsion Laboratory. The remainder of the imagery (NOAA, Metop_A) and ENVISAT MERIS and SAR are being downloaded from a variety of data servers. We are capable of downloading the MODIS data from NASA, but due to the 6-8 hour time delay of the data from their servers we prefer to use the University of South Florida IMaRS data server. We manipulate and integrate these data at ROFFS™ and the analyses are ROFFS™ expert interpretations of the satellite imagery integrated with other data such as winds, sea surface temperature (sst) from buoys, currents from drifting buoys (from NOAA_AOML and Horizon Marine) and acoustic doppler current profilers from ships and oil platforms (when occupied and working), as well as, in-situ reports. We routinely discuss our results with oceanographers from industry, academia and government. We use a plethora of techniques to remove or reduce the effect of clouds (e.g. making composites and mosaics), effects of satellite angle (re-navigation of each image), and the effects atmosphere interference (e.g. re-calibrate the infrared imagery from ocean buoys and ships of opportunity), to manipulate the satellite data to understand the ocean circulation patterns associated with the oil’s motion. We have many years of experience conducting similar analyses. For example we mapped the plume coming from the New Orleans area after Hurricanes Katrina and Rita
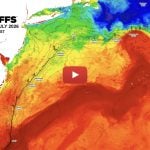
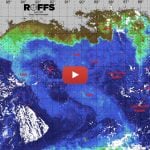
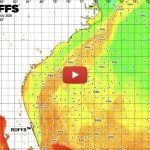
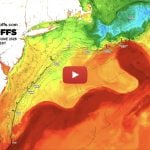
The ROFFS™ analysis is composed of a text and graphic. The text is a description of the overall ocean circulation and focuses on the significant flow fields in the area of interest (e.g. eastern Gulf of Mexico). It includes a discussion of the distribution of the oil and likely short-term movements, as well as, other pertinent information including validation evidence. The graphic is an ocean frontal analysis derived primarily from infrared and ocean color satellite data. The background is usually the best short-term infrared image that we derive using a variety of iterative procedures. A color sst palette is included. The graphic shows a navigation gridlines in latitude – longitude coordinates and a coastal outline. Often important bottom topographic features are included. We only include the significant water mass boundary features which we have learned are important in understanding the flow field, sst gradients, and convergence zones. Overlaid are shapes that are manually drawn that outline the area of the surface oil derived from SAR, RGB, and other visible image products. The outlines are filled with a distinct color usually olive green. Surface areas of water masses that we have been able to track continuously from the Deepwater Horizon spill are also outlined and shaded in another distinct color. Arrows showing the direction (not speed) are included, as are labels of important oceanographic features (e.g., major currents and eddies). The analyses can be sent either as a combined graphic and text in an Adobe™ PDF format, or as two separate components (text and graphic).
While we have been conducting these analyses as a civic duty and as an exercise in technology transfer, we would like to be contracted to do this to support cleanup, restoration, and litigation, as well as, ecosystem research efforts. We are looking for financial backers of this effort. Please enquire about this. If you plan to use these reports or derive new products based on this work including the graphics you must give ROFFS™ full credit. ROFFS™ would be appreciative if you would copy this analysis to others who may be interested in our efforts.