
Fish Forecasting
Ocean-analysis services help put you on fish quicker and more efficiently.
By Georege Poveromo
Keith Brack was on top of the world after releasing his first blue marlin, fishing with his dad and me off Bimini, Bahamas, this past June. We caught the fish trolling in 1,500 to 1,600 feet of water, tight to the island. The next day, we trolled the same zone without luck, and even stayed the same course until noon on day three. A report from Roffer’s Ocean Fishing Forecasting Service showed a 1-degree temperature break several miles off Bimini over deep structure. We made the move, and after three hours of trolling, Brack fought and released his second blue marlin of the trip, an estimated 250-pounder.
Such a scenario wasn’t new to us. In fact, it has played out many times for dolphin, and even marlin and yellowfin tuna. Knowing exactly where potentially potent stretches of water are prior to leaving the dock bolsters confidence, and can possibly reduce fuel consumption by eliminating a lot of searching. We call it precision targeting.
There are numerous means of obtaining water-surface temperature readings, ranging from raw satellite imagery to detailed analyses that actually edit down the masses of water temps and highlight only the most significant ones, for simplified and quick interpretation. In addition, some of these charts also list the duration of significant, stable surface-temperature breaks, as well as other oceanic-circulation features. For decades I’ve relied upon Roffer’s Ocean Fishing Forecasting Service (roffs.com), a leader in turning the raw satellite data into useful information. Even though such information is spoon-fed via email or fax, getting the most from the intel requires a good understanding of how to read these analyses.
Hot Edges
Productive zones often occur along a water-surface-temperature break. Such a break signifies either two different water masses (water types with different densities), the infiltration of a warm water finger or filament, an eddy, or an upwelling that pushes deep layers of cool water toward the surface. When different currents lie next to each other, they often have thermal variations along with upwellings, which bring nutrients to the surface along these convergence zones. And, in turn, these often result in plankton blooms which, if stable, establish mini ecosystems, which draw tiny baitfish that feed on the blooms, followed by slighter larger baitfish, which feed on the smaller baitfish — all the way up the line to top-tier predators.
Warm, tropical-water systems carry game fish with them. Major systems include the Loop Current in the Gulf of Mexico, and the Gulf Stream moniker it acquires as it rounds Florida and heads north; the eddies from the stream that peel away and drift toward shore of the mid-Atlantic and New England coasts; and the warm, tropical water of Southern California, when it migrates northward during El Niño episodes. When these warmer blue waters meet cooler, inshore and greener continental- slope waters, they create major feeding zones. When water-surface-temperature breaks occur within the depth range of your target species, pay special attention to them.
Hard structure
Like that underwater hill over which Brack scored his second blue marlin, bottom structure relating to thermal edges bolsters the presence of game fish. Such structure may be small mounds, mountains, shelves, depressions, canyon edges, pinnacles, wrecks and reefs. These habitats naturally hold forage species and often game fish. When a warm-water edge or current moves over these structures, upwellings usually occur. As a general rule, water-surface-temperature breaks alone out in deep water are good zones to fish. However, a temperature-break crossing or intersecting prominent bottom structure has far more potential because of its ability to aggregate nutrients and bait.
Holding Hard
The length of time an edge remains over structure determines its importance in pinpointing fish. Basically, the longer a thermal break remains in place, the better its potential for establishing a thriving mini ecosystem. For example, if a break has recently parked over a major structure, it will likely not be as productive as one that has been in place for a few days. Roffer’s analysis notes major surface temperature and color breaks as well as the duration of their position over prime bottom. The latter appear on an analysis chart as numerically dubbed black dots. Therefore, a “2” signifies a break that has been in the same place for the past 48 hours, whereas a “3” or “4” reveals a 72- and 96-hour duration, respectively. Shoot for the long-standing breaks.
Know the flow
Ocean-circulation features are yet another part of successful analysis interpretation. This involves precisely locating the true edges of the Gulf Stream, as well as the edges and flow directions of eddies and fingers that spin of to the sides.
A common misconception is that once you’ve found blue water, you’ve reached the Gulf Stream of South Florida. You can be in 1,000 feet of blue water, but not in the stream, which might reduce your chances of catching fish. The Gulf Stream meanders like a snake; constantly changing. One day the true western edge might be 8 miles of Miami, while the next day it could be 14 miles off. This is where an accurate analysis chart helps: It reveals the true location of both eastern and western edges of the Gulf Stream, as well as any features within the stream itself, like upwellings, which are often seen as color or clarity changes. Look for baitfish and game fish on weed lines and debris accumulations along these true edges as well, especially sections that push tight against the Continental Shelf.
Features such as fingers, filaments and eddies that overlie the structure (from deep to shallow) are often the best zones to fish because they strike the rising bottom structure and seem to push baitfish away from this sanctuary, making them more vulnerable. Detailed analysis charts show water-direction movements as well.
Movements
One common question regarding fishing analysis received the evening prior to a trip is, “What happens if a reported break is not where it’s supposed to be?” Currents and ocean circulation features change constantly. Sometimes conditions remain several hours after you’ve received an analysis, especially breaks parked 24 hours or more over structure. Other times they may have shifted.
Once you are on the water, stay alert for such breaks and ocean-circulation features well before you reach your destination. You might find that slug of warm water several miles short of your target. If there’s bait around, and it’s still within your game fish’s depth range, stop and fish there. Also, major breaks often follow the natural current flow. So don’t be afraid to look downstream of where a break was supposed to be, using the speed of the current and the time of the last analysis to give you an idea of how far to search. Start where the conditions have been good for a few days, then move if the fshing action fails to meet your expectations. The fish will be somewhere between the bottom structure and the moving current-convergence zone.
Most of all, once nearing or in a zone, watch for baitfish and signs of life. The fish are here to forage, and if there are no forage species, there will be no game fish. In the end, it really is all about the bait. These analysis charts help you dial in on that.
[one_half]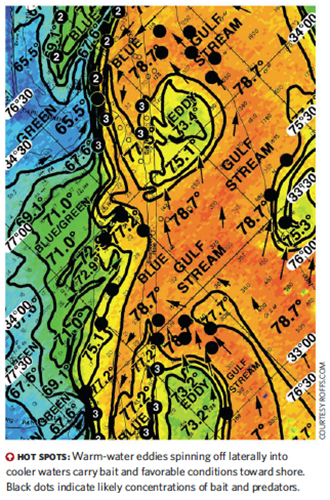 [/one_half] [one_half_last]
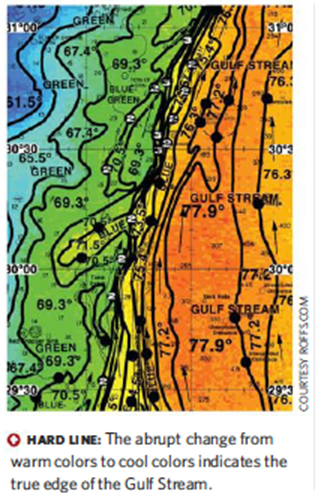 [/one_half_last]


