Background:
Since 2003 we have been developing an objective method for forecasting the overall fishing action during the entire Bahamas Billfish Championship (BBC) tournament season. The hypothesis for forecasting the seasonal marlin fishing action stems from the location and geographic extent of the bluer and often warmer water that occurs from the Cat Island – San Salvador Island area and south where it is presumed that the marlin concentrate before and during spawning. We have been calling this water “blue marlin water.” It is assumed that the marlin are associated with this water and the more “blue marlin water” that exists in the Abaco Islands and Eleuthera Island areas, the greater the marlin relative apparent abundance will be in these areas. Also in recent years we have observed an association between this water and the yellowfin tuna action in the Bahamas, as well as, along the western side of the Gulf Stream between Jacksonville, Florida and Cape Hatteras, North Carolina. In addition, we are studying the links between this water and the relative apparent abundance of yellowfin tuna from Cape Cod, Massachusetts to Virginia Beach, Virginia. But as this article is focused on the blue marlin and the Bahamas, the discussion related to yellowfin tuna, the overfishing off west Africa, and catch rates off the United States east coast will have to wait for another article.
Based on our observations of the fishing action and ocean conditions in the Bahamas, particularly from Eleuthera to the Abacos over the last 20+ years it appears that excellent fishing action overall occurs within the BBC tournament area when there is a substantial volume of the “blue marlin water” pushing over the 100 fathom and shallower ledges along the eastern side of Eleuthera and the Abacos. Relatively good fishing seasons occur when this water occurs over the 500-1000 fathom depths, but not the 100 fathom and shallower depths of both areas. Mediocre years occur when there is a lack of this water over these areas. It is also very important to understand that good fishing action on a daily basis is linked to the favorable direction of these currents and when the water mass boundaries of these currents are stable for three to five consecutive days over good bottom topography that normally concentrate the prey fish. For the BBC tournament areas, the dissolved oxygen concentration does not appear to be a major factor at the present time compared with the temperature and clarity of the water. In other areas south, the dissolved oxygen has a greater controlling factor on fish distribution.
The working hypothesis is based on the hourly satellite observations of the ocean conditions derived by Roffer’s Ocean Fishing Forecasting Service, Inc. – ROFFS™ (roffs.com) and catch reports provided by a variety of sources over 20+ years. The infrared (IR) satellite data are used to observe the sea surface temperature (sst) and the ocean color data are used for indices of phytoplankton, clarity, and colorized dissolved organic material are received from a variety of sources including NASA, NOAA, and the European Space Agency (ESA). ROFFS™ also uses data derived from drifting buoys, gliders, aircraft and from satellite altimeters. The altimeter data only provide a very course spatial resolution and the time delay (10 days to produce usable circulation models), limits the data’s utility. While the ocean changes significantly over 10 days, the altimeter data can be used for an overall, albeit 10 day average view of the ocean’s surface circulation. It is not useful for evaluating small scale, short-term (daily and sub-daily) changes in the ocean currents or their boundaries.
During the last several years we had observed that the conditions over the BBC tournament area were particularly favorable as early as January to the first week in March in terms of the presence of “blue marlin” water off Abaco and Eleuthera as exemplified by the first week in March, 2012 (Figures 1 & 2).
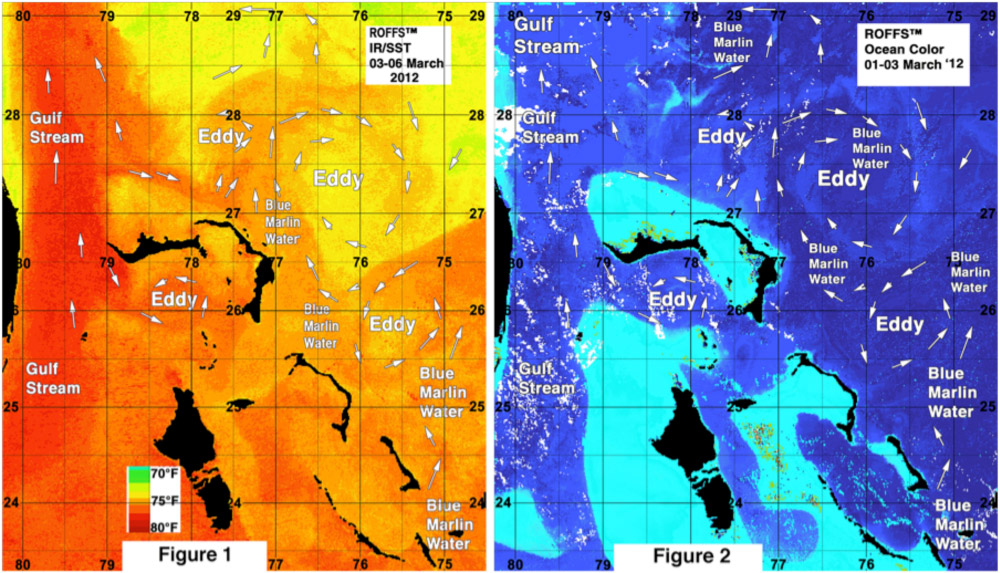
As stated earlier, the critical aspect for having a good blue marlin season is the presence of the blue marlin water pushing over the 100 fathom curve creating persistent convergence zones for food to concentrate. Figures 1 and 2 show the distribution of the blue marlin water prior to the 2012 BBC season. Figure 1 was derived over the March 03-06, 2012 period using a variety of IR satellite data from NOAA, NASA, and ESA that shows the water masses based on their signature sst. Figure 2 is an ocean color image that was derived from NASA and ESA satellites over March 01-03, 2012 that shows the water masses based on their signature ocean color. Clouds prevented us from providing an exact match in time due to the clouds associated with the strong cold front that stalled over the Bahamas during this period. But using a variety of computer techniques ROFFS™ was able to remove many of the interfering clouds to allow a one day overlap of the imagery to provide a better comparison.
During the actual 2011 and 2012 tournament fishing seasons the “blue marlin” water was pulled away from the BBC tournament area by the ocean currents from various eddy features similar to what had been observed prior to the fishing season in 2011 (Figures 3 & 4). While some good fishing action happened during these years due to the intermittent arrival of the “blue marlin” water, unfortunately, the favorable conditions were not persistent throughout the entire tournament season like some of the banner years in the 1990’s and early 2000’s.
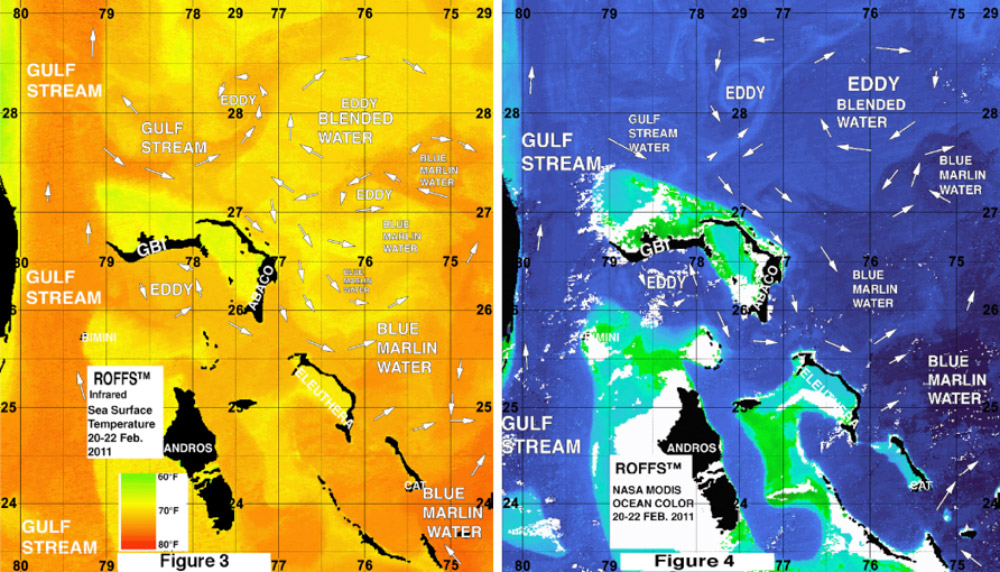
Figure 3 was derived from a variety of NASA and NOAA IR satellites and Figure 4 was derived from the NASA MODIS ocean color imagery during February 20-22, 2011. While these provide examples of pre-season conditions, they also provide examples of how the eddy features pulled the “blue marlin” water away from the BBC tournament area.
2013 SEASONAL FORECAST
In years past we have been forced by the “King of the BBC” (Al Behrendt), to forecast the BBC season from data available at the end of February and first week of March, However, this year the wonderful Brenda and Jennifer convinced the king that we could have almost another month to accomplish our task. One of the challenges of producing a such an early forecast is that these exciting and entertaining fishing events extend over a relatively long time period. Formerly from the last week in April through the third week of June (e.g. 2012). Conditions are likely to change dramatically from one event to the next without any proven methods to predict the changes. This is confounded by the fact that there still are no reliable numerical oceanographic models or even atmospheric models to use to make accurate and reliable high resolution localized oceanographic forecasts that extend the entire season. ROFFS™ is working with other oceanographers to develop improved ocean models, so perhaps next year our task for the seasonal forecast will be easier. This year (2013) the first BBC tournament starts April 15th which allowed us to observe the conditions another three weeks compared with previous forecasts which gives greater insight into the conditions at the true start of the tournament season.
At ROFFS™ we believe that the conditions observed now are generally likely to continue into the short-term future (days – weeks time frame) unless we can see reasons that the trend in present conditions would dramatically change. Comparing the preseason conditions annually provides insight into whether or not we are observing “normal” or climatologically mean conditions or anomalies. We have derived a few indices of our own for this. One is the core sea surface temperature of the Gulf Stream east of Miami.
The ROFFS™ 11 year (2003-2013) mean sst for the core of the Gulf Stream off Miami was 78.3°F during our standard March 05-06, 2013 measurement period. The range has been as low as 74.8°F (2009) to a high of 80.5°F (2007). This year the SST was 78.1°F. While have not been recording the SST off Cat Island during this same period, the six year mean (2008 – 2013) SST for the Cat Island area is 76.3°F and this year the SST was a warmer 77.6°F. During March 28-29, 2013 these sst were 78.4°F (Gulf Stream) and 76.4°F (Cat Island). While we are unsure of the significance of the relatively cooler sst in the off Cat Island other than prior to and at the time of these measurements that there were a series of cold fronts that passed through the Bahamas that cooled the water and that the continued cloud cover prevented more rapid warming. More details will be provided below regarding other reasons for the cooler conditions of Cat Island .
The global, hemispheric and regional climate models provide some guidance into the present and future conditions. We use the climate data, analyses, and forecasts provided by Columbia University’s International Research Institute (IRI) for Climate and Society, (http://portal.iri.columbia.edu/portal/server.pt and //pred.ldeo.columbia.edu/forecast/climate/multi/), and NOAA’s Climate Prediction website (http://www.cpc.ncep.noaa.gov), as well as, the Florida State University Center for Ocean-Atmospheric Prediction Studies program (www.coaps.fsu.edu). We use catch data from a variety of public and private sources. According to IRI’s global models the precipitation in the BBC area from April through June the sst and rainfall will be at the climate mean, while the air temperatures will be warmer than the mean. In the past we have discussed the El Niño – La Niña index, but we have learned that these oscillations do not appear to have much affect on the oceanographic conditions in the Caribbean including the Bahamas.
As suggested last year, we started considering other indices such as the North Atlantic Oscillation (NAO) and the Atlantic Multidecadal Oscillation (AMO). Without going into great detail the NAO is the dominant mode of winter climate variability in the North Atlantic region ranging from central North America to Europe and much into Northern Asia. The NAO is a large scale seesaw in atmospheric mass between the subtropical high and the polar low. The corresponding index varies from year to year, but also exhibits a tendency to remain in one phase for intervals lasting several years. The North Atlantic Oscillation (NAO) is a climatic phenomenon in the North Atlantic Ocean of fluctuations in the difference of atmospheric pressure at sea level between the Icelandic low and the Azores high. Through east-west oscillation motions of the Icelandic low and the Azores high, it controls the strength and direction of westerly winds, currents, and storm tracks across the North Atlantic Ocean. It is part of the Arctic oscillation, and varies over time with no particular periodicity. It is one of the most important manifestations of climate fluctuations in the North Atlantic and surrounding humid climates (see Wikipedia and the previously listed web links for more details). For future reference the 2013 NAO Index in January was positive (0.35) and February negative (-0.45), while in 2012 it was 1.17 and 0.42 respectively. The AMO Index in 2013 in January and February was positive 0.158 and 01.47 and in 2012 it was -0.038 and 0.031 respectively. We will continue to investigate the relationship between these indices and the oceanographic conditions in the Bahamas in the future. But we included this information to spark your interest in climate indices.
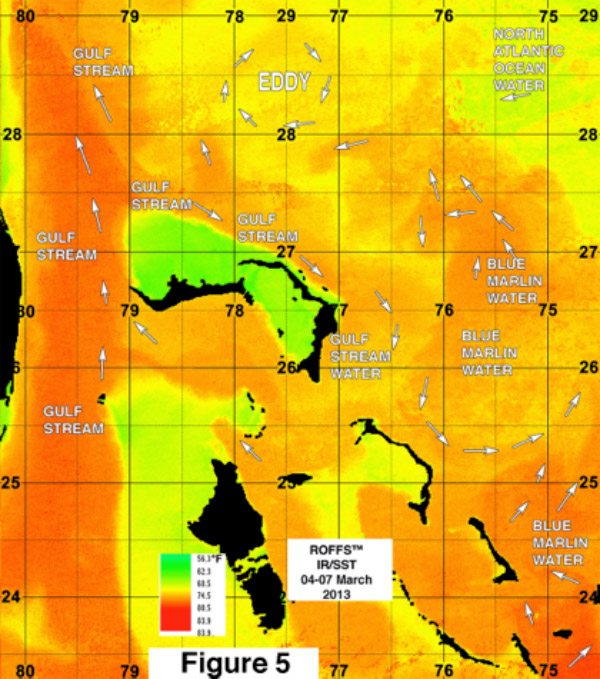
Figure 5 (above) shows the sst and ocean circulation features in the Bahamas over the March 04-07, 2013 period. It took four days of satellite data to remove most of the obstructions due to the clouds. This shows the relatively unfavorable conditions for blue marlin that existed over this region. The “blue marlin” water occurred mostly east and south of Cat Island (centered 75°30’W & 24°30’N). This water was being pulled northeastward. Some of the “blue marlin” water had been pulled westward (from the areas not shown but east of this figure) and moved in a mostly northward direction. The Gulf Stream water was moving southeastward along the northern Bahamas island chain from Walkers Cay to the eastern Abaco Islands. There were too many clouds during this period to provide an matching ocean color image.
Figure 6 below is shows the sst and ocean circulation features in the Bahamas derived for the March 27-29, 2013 period. Figure 7 shows the ocean color image for the March 22-28, 2013 period. These figures show the substantial changes and improvements in the ocean for blue marlin conditions during March.

The “blue marlin” water that was in close proximity on the east side of Cat Island was pulled northward by a clockwise rotating eddy centered near 74°30’W & 26°15’N. Due to another eddy that no longer occurs in this area a substantial volume of this water was pulled westward. As of March 29th another clockwise eddy centered near 76°15’W & 25°45’N continued to pull the “blue marlin” water in a southwestward direction toward Eleuthera, which in turn was being pulled northward along the eastern side of the Islands due to the circulation north of the island chain between the Great Abaco and Walkers Cay. We anticipate that this blue water will remain in the BBC area for the next few weeks. While the sst is not particularly warm (74.5°F-75.5°F), these conditions are expected to remain favorable for a combination of white marlin, sailfish and blue marlin to be in the BBC area.
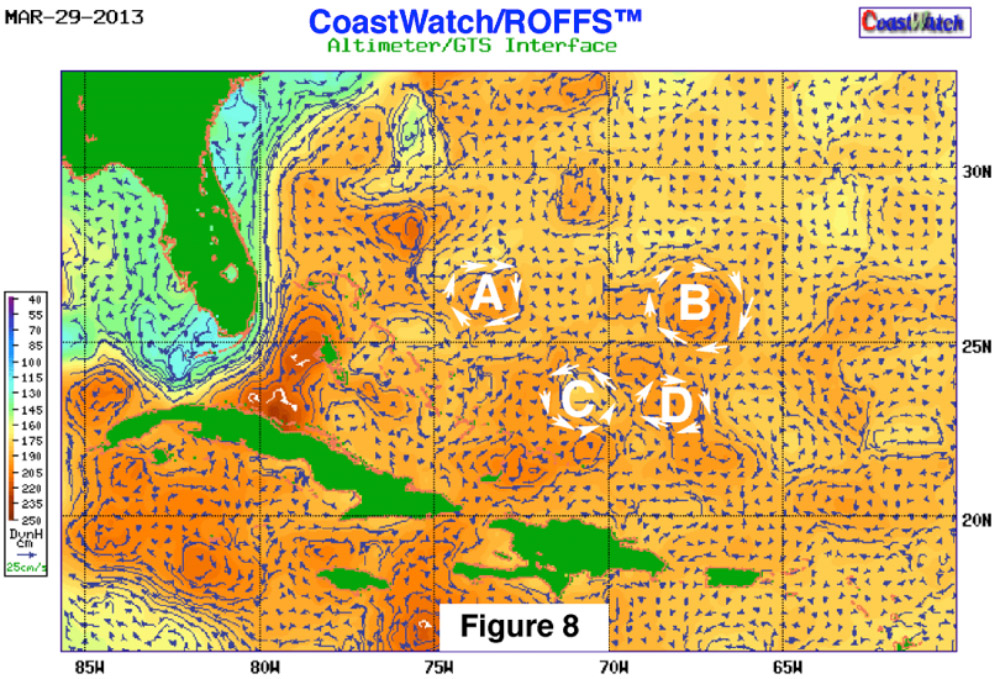
For the longer term the conditions are not as favorable as suggested by the circulation shown in Figure 8. This figure is derived from altimeter data over March 19-29, 2013 from the free NOAA CoastWatch site (http://www.aoml.noaa.gov/phod/dataphod/work/trinanes/INTERFACE/. Eddy “A” is the same eddy shown in Figure 6 centered near 74°30’ & 26°15’N. The not so good news is that there is a substantial clockwise eddy, “B”, centered near 67°30’W & 26°00’N that is pulling the “blue marlin” water that currently exists east of Crooked Island and Mayaguana away from the BBC area. This water is also being pulled northeastward by a counter-clockwise eddy (“C”) and a clockwise eddy (“D”). These eddy features are keeping the “blue marlin” water from reaching the Cat Island area. These three eddy features are likely to drift in a northwestward direction over the next several weeks keeping the water away from the BBC tournament area. However, if these four eddy features move more westward, then they will bring the water into the Eleuthera to Abaco Islands area.
We will continue monitoring these developments as the season progresses and will provide updates. It is very important to note that good fishing action on a daily basis is strongly linked to local current conditions. When the water mass boundaries of these currents are favorable, i.e., persistently pushing over good bottom topography, then they concentrate the bait fish and larger fish. Thus, the good fishing action on any given day is controlled by relatively short term (daily) and relatively small scale movements of the currents which can only be forecasted reliably the day before they occur. Stay tuned for these daily fishing forecasting analyses as subtle changes in the currents and convergences have dramatic impacts on the distribution of feeding concentrations of fish. Get ready for the BBC as the fun and good fishing are about to happen!
Safe and Successful Fishing,
Mitchell A. Roffer, Ph.D.